


 Set as a preferred Google source
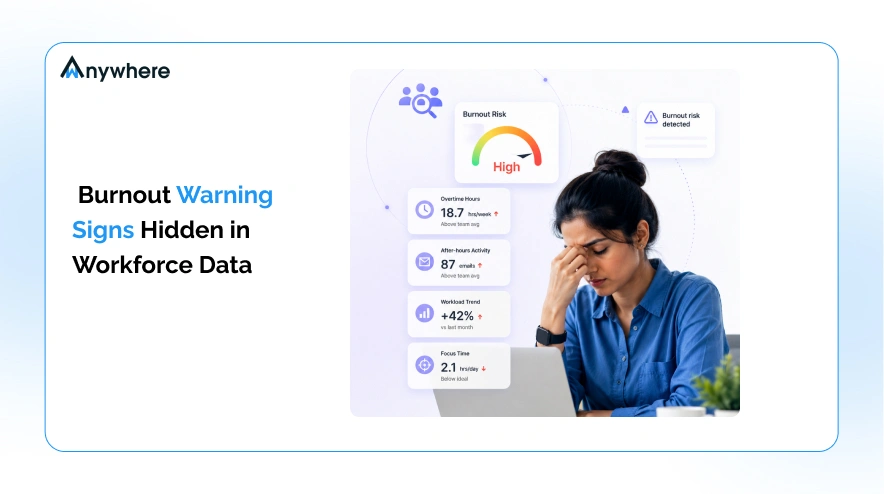
Most burnout stories end the same way: a resignation letter, an exit interview, and a manager asking “I didn’t see this coming, did I?” The honest answer is usually that the signs were there. They just weren’t in a conversation. They were in a calendar, a login log, a task tracker, and a Slack timestamp.
Burnout rarely announces itself. It builds quietly, through small behavioral shifts that are easy to miss in a hallway chat but hard to miss in workforce data. Gallup’s 2026 State of the Global Workplace report found that global employee engagement fell to 20% in 2025, its lowest point since 2020, with the decline costing the world economy an estimated $10 trillion in lost productivity. That’s not a story about a handful of unhappy people. It’s a system-wide signal, and systems leave data trails.
This piece looks at what those trails actually look like: the employee burnout signs that show up in workforce data long before they show up in a resignation, and how HR leaders, People Ops managers, and team leads can use that data to intervene early instead of reacting late.
What is employee burnout, really?
Burnout isn’t a bad week or a rough sprint. The World Health Organization’s ICD-11 classification defines burnout as a syndrome resulting from chronic workplace stress that hasn’t been successfully managed, and it names three specific dimensions: feelings of energy depletion or exhaustion, increased mental distance or cynicism toward one’s job, and reduced professional efficacy. Notably, the WHO frames burnout as an occupational phenomenon tied specifically to the workplace, not a personal failing or a general mental health diagnosis.
That distinction matters for how managers should respond. Burnout is a workplace design problem as much as an individual one. It shows up when workload, autonomy, recognition, and boundaries fall out of balance for a sustained period, not just after one hard deadline. Because it develops gradually, it’s often invisible in the moment and only obvious in hindsight, which is exactly why data patterns matter more than gut instinct here.
Why workforce data reveals burnout before people do
Employees experiencing burnout rarely announce it directly. Many don’t recognize it in themselves until it’s advanced, and even those who do often hesitate to say so, especially in cultures where being “always on” reads as commitment. Self-reporting mechanisms like engagement surveys are useful, but they’re backward looking and voluntary. Someone has to notice something is wrong, decide to disclose it, and trust that disclosure won’t be held against them.
Workforce data doesn’t have that lag. Attendance patterns, activity tracking, task completion rates, and communication frequency update continuously and don’t depend on someone deciding to speak up. A person’s actual working patterns, when hours are logged, how output trends over time, how communication activity shifts, tend to change before their stated satisfaction does. That’s the core argument behind data-informed burnout detection: it catches the behavioral signal before the self-report catches up to it.
This is also where the manager visibility gap comes in. According to APA’s 2025 Work in America survey, roughly two-thirds of employed adults reported that their company had been affected by recent government policy changes, and a majority said job insecurity was significantly affecting their stress levels at work. Layer that on top of already-thin manager bandwidth, and you get a common failure mode: managers who care about their people but don’t have a consistent, objective way to catch strain before it becomes attrition.

See burnout before your team’s engagement scores do
wAnywhere turns everyday workforce data into an early-warning system for burnout and attrition.
8 employee burnout signs hidden in your workforce data
Individually, each of these signals can have an innocent explanation. Together, and sustained over weeks rather than days, they form a pattern worth investigating.
Declining output paired with longer hours
When someone starts logging more hours but producing less, that’s not a motivation problem, it’s usually a capacity problem. Burnout reduces cognitive efficiency long before it reduces effort, so people compensate by working longer to hit the same output, which accelerates the exhaustion that caused the slowdown in the first place. Watch for a rising ratio of hours logged to tasks completed over a two-to-four-week window.
Rising after hours and weekend activity
Owl Labs’ 2025 State of Hybrid Work report found that a large majority of workers said their work stress levels were the same or worse than the previous year, and that managers were specifically concerned about employees overworking and burning out. A steady creep in evening logins, weekend task activity, or after-hours messages is one of the clearest early indicators that boundaries are eroding, especially for remote and hybrid employees who lose the natural cutoff of leaving an office.
Shrinking break and downtime patterns
Consistent, visible breaks are a sign of a sustainable pace. When break frequency or length starts shrinking, and stays shrunk, it often means someone feels they can’t step away without falling behind. This is one of the more subtle signals because it looks like dedication on the surface.
Spike in missed deadlines or task reassignments
Reduced professional efficacy, one of the WHO’s three core burnout dimensions, shows up operationally as slipping deadlines and a rising need to reassign or redistribute someone’s work. A single missed deadline is normal. A pattern of tasks quietly moving off one person’s plate is a signal worth a direct conversation.
Erratic login and logout times
A previously predictable schedule that starts fragmenting, early one day, very late the next, long gaps mid-afternoon, often reflects disrupted sleep, difficulty concentrating, or attempts to catch up after falling behind. Irregular scheduling is different from flexible scheduling; the difference is whether the pattern is a choice or a symptom.
Drop in collaboration or communication activity
Mental distance and cynicism toward one’s job, the second WHO dimension, tends to show up as withdrawal. That can mean fewer messages in team channels, less participation in meetings, slower response times, or a noticeable drop in proactive communication from someone who used to be vocal. It’s easy to mistake for someone simply being “heads down,” which is why it’s worth checking against their output trend at the same time.
Idle time followed by late night work bursts
A pattern where someone appears inactive for stretches during the day and then shows concentrated activity late at night often points to fatigue-driven procrastination followed by a scramble to catch up. This cycle is self-reinforcing: the late hours make the next day’s fatigue worse, which pushes more work later again.
Sudden shifts in attendance or PTO patterns
Both directions are worth watching. A sudden spike in sick days or unplanned absences is a classic burnout indicator, but so is someone who stopped taking PTO entirely, especially if they had a normal pattern of using it before. Employees under sustained stress often stop taking the breaks that would help them recover, which is precisely the wrong direction.
Would you catch these 8 signs in your own team?
wAnywhere surfaces the behavioral patterns behind burnout, automatically, before a resignation letter does.
Employee burnout statistics every manager should know
The scale of this problem is why “keep an eye on it” isn’t a sufficient strategy anymore. A few figures worth sitting with:
Gallup’s 2026 report puts global employee engagement at 20% for 2025, the lowest level since 2020 and the first time engagement has fallen for two consecutive years, with the decline estimated to cost the global economy $10 trillion in lost productivity. Manager engagement dropped even faster: Gallup recorded a five-point decline in manager engagement between 2024 and 2025, from 27% to 22%, meaning the “engagement premium” managers used to hold over their teams is disappearing.
On the individual worker side, APA’s 2025 Work in America survey found that more than half of U.S. workers said job insecurity was having a significant impact on their stress levels, and around two-thirds reported that recent government policy changes had affected their organization in some way. Owl Labs’ 2025 State of Hybrid Work report similarly found that the large majority of workers rated their stress levels as unchanged or worse year over year, with managers specifically flagging overwork and burnout as a top concern for their teams.
The pattern across all three sources is consistent: stress and disengagement are rising, managers are stretched thinner than the people they lead, and organizations that rely purely on people noticing and reporting it are working with a lagging indicator.
Read More: How to Evaluate Employee Quality of Work
Remote and hybrid work burnout: what’s different in the data
Remote and hybrid arrangements don’t create burnout on their own, but they do change how it shows up. In an office, a manager can notice someone staying unusually late or looking exhausted. In a distributed team, that same signal only exists in data: login timestamps, activity patterns, and communication logs.
Owl Labs’ research highlights a specific dynamic worth noting: their 2025 report found managers were more concerned about burnout among in-office employees than remote ones, even as remote and hybrid workers face their own boundary-erosion risks from blurred home-work lines. That gap between where managers direct their attention and where the actual risk sits is exactly the kind of blind spot workforce data is built to close.
For distributed teams specifically, the signals to weight more heavily are after-hours activity, weekend logins, and erratic scheduling, since these are the patterns most directly shaped by the absence of a physical commute or office cutoff. A remote employee’s laptop doesn’t know it’s 9 PM on a Saturday. Their workload should.
How to use workforce analytics to catch burnout early
The goal isn’t constant surveillance for its own sake. It’s building a baseline for each role or team, then watching for sustained deviation from that baseline rather than single bad days.
A workforce analytics platform like wAnywhere gives HR leaders and team leads visibility into the underlying behavioral patterns, active hours, break frequency, application usage, task completion trends, without requiring someone to first notice a problem and speak up about it. Instead of relying solely on quarterly engagement surveys or a manager’s read of the room, teams get a continuous, objective view of how work patterns are trending over time, which makes it possible to flag a two-week decline before it becomes a two-month crisis.
The practical workflow looks like this: establish a normal range for each role, set alerts for meaningful deviations (not every anomaly), and route flagged patterns to a manager for a human conversation, not an automated intervention. Data should open the door to a check-in. It shouldn’t replace one.
Employee burnout prevention: turning data into action
Spotting the signal is only half the job. What happens next determines whether the data actually prevents attrition or just documents it after the fact.
Start with workload rebalancing before performance conversations. If the data shows someone’s hours are climbing while output falls, the first move should be redistributing tasks, not questioning their commitment. Second, normalize PTO usage actively; if someone has stopped taking time off, a manager should raise it directly rather than waiting for it to become a bigger issue. Third, build in recovery time after high-intensity periods rather than immediately loading the next project onto a team that just cleared a deadline crunch. Finally, train managers to read the data alongside their own observations, since the combination of both is far more reliable than either alone.
None of this requires guessing. It requires a consistent source of behavioral data that updates continuously and a manager who’s equipped to act on it early.
Give your managers the visibility they’re missing
Continuous workforce analytics that flag strain early, so 1:1s catch it before it becomes attrition.
Signs of burnout at work: a quick manager checklist
Use this as a fast scan during a 1:1 prep or a team health check.
- Hours logged are rising while completed output is falling
- After-hours or weekend activity has become a regular pattern, not an occasional exception
- Break and downtime patterns have visibly shrunk over the past few weeks
- Deadlines are slipping or tasks are quietly being reassigned
- Login and logout times have become erratic compared to their normal schedule
- Communication and collaboration activity has dropped off noticeably
- Idle stretches during the day are followed by late-night work bursts
- PTO patterns have shifted sharply in either direction (spike in absences or a sudden stop in time off)
If three or more of these are true and sustained over several weeks, it’s time for a direct, supportive conversation, not a performance review.
Frequently Asked Questions
Can workforce monitoring data really predict burnout?
Workforce data can't diagnose burnout on its own, but it can reliably flag the behavioral patterns, extended hours, reduced breaks, erratic scheduling, communication drop off, that consistently precede it. Think of it as an early-warning system that prompts a human conversation, not a diagnostic tool that replaces one.
How is burnout different from normal work stress?
Normal stress tends to be tied to a specific event, like a deadline or a launch, and resolves once that event passes. Burnout, as defined by the WHO's ICD-11 classification, results from chronic workplace stress that hasn't been successfully managed, and it persists even after the immediate trigger is gone. It's marked by ongoing exhaustion, growing cynicism toward the job, and a real drop in effectiveness, not a temporary dip.
What should managers do when they spot burnout signs in the data?
Start with a direct, non-judgmental conversation rather than a performance discussion. Ask what's changed for them, check whether workload has become unsustainable, and be prepared to actually redistribute tasks or adjust deadlines rather than just acknowledging the problem. Data should trigger support, not scrutiny.

Table of Contents
Boost productivity and compliance with wAnywhere
Read summarized version with


