Most COOs can tell you their revenue per employee. Far fewer can tell you why that number moved last quarter, or where it is heading next. Workforce decisions made without data carry a real and recurring cost, including avoidable turnover, idle headcount, overtime bleed, and compliance exposure, all of which only show up once it is too late to act on them.
The board does not want to hear that workforce analytics is strategic. They want a number. This guide gives COOs a practical framework for getting to that number: the six metrics that matter most, a four step ROI calculation model, and what to look for in a platform before signing off on the investment.
Why Workforce Analytics ROI Is Hard to Prove, and How to Fix That
The core problem is not a lack of data. Most organizations have plenty of it. The problem is that they measure workforce analytics outputs, such as dashboards and reports, rather than business outcomes, such as cost saved and productivity gained. A platform can generate a hundred charts a month and still leave the COO unable to answer a simple question from the board: what did this investment return?
Three issues tend to repeat across organizations that struggle to make this case. The metrics being tracked are too operational and never get connected back to financial outcomes. Data lives in silos, with HR, payroll, and productivity tools that do not talk to each other, so no single source can produce a clean cost picture. And no baseline was ever set before the analytics investment was made, which means there is nothing credible to compare against after the fact.
The fix is to treat workforce analytics ROI the same way you would treat any other capital investment. Establish a baseline, define the specific value levers the investment is supposed to move, and measure progress against them every quarter rather than once a year.

Know Your Hybrid Workforce Savings Before You Build the Business Case
Use wAnywhere’s free ROI calculator to estimate turnover, overtime, and utilization savings in minutes.
The 6 Workforce Metrics That Directly Drive Financial Outcomes
Not every workforce metric belongs in a board conversation. The six below earn their place because each one converts directly into a dollar figure, not just an operational observation.
Revenue per Employee
Calculated as total revenue divided by headcount, this metric reveals team efficiency, output quality, and whether parts of the organization are overstaffed or underutilized. A five percent improvement in revenue per employee at a five hundred person company translates into a meaningful bottom line gain without adding a single new customer.
Employee Utilization Rate
Calculated as productive hours divided by available hours, multiplied by one hundred, this metric is especially critical for remote and hybrid teams, where idle time is effectively invisible without analytics. Idle time is a direct payroll cost with zero output return, which makes it one of the fastest levers to act on once it is visible.
Voluntary Turnover Rate by Department
Calculated as employees who left voluntarily divided by average headcount, multiplied by one hundred, this metric carries an outsized financial weight. The Society for Human Resource Management has found that replacing an employee typically costs between 50 and 200 percent of their annual salary, depending on seniority and role complexity. A ten percent reduction in voluntary turnover across a two hundred person team can save an organization hundreds of thousands of dollars annually.
Time to Productivity for New Hires
Defined as the time between a new hire’s start date and the point at which they reach full output, this metric is frequently underestimated. Research published in MIT Sloan Management Review found that time to full productivity ranges from roughly eight weeks for clerical roles to twenty weeks for professional roles, and more than twenty six weeks for executive roles. Every week a new hire operates below full productivity is a partial wage cost paired with a partial output return.
Overtime and Idle Time Ratio
This metric sends a dual signal. Overtime points to understaffing or poor workload distribution, while idle time points to overstaffing or disengagement. Both represent the same underlying problem from opposite directions, which is payroll inefficiency. One costs more than what was budgeted, the other delivers less than what was budgeted.
Absenteeism Rate and Its Productivity Cost
Calculated as days absent divided by total workdays, multiplied by one hundred, absenteeism is often dismissed as a minor HR concern. It should not be. Gallup’s research on workplace engagement has found that employees who are not engaged cost their organization the equivalent of 18 percent of their annual salary in lost productivity, a gap that shows up in absenteeism, error rates, and missed deadlines long before it shows up on a P&L line.
Read More: KPIs Every Work Model Should Track
How to Build a Workforce Analytics ROI Model in 4 Steps
This is the section that separates a workforce analytics initiative that gets renewed from one that quietly gets cut at the next budget review. The model below is straightforward enough to run with a spreadsheet, but disciplined enough to hold up in front of a CFO.
Step 1: Set Your Baseline Before You Measure Anything
Before evaluating any platform or initiative, document your current state: annual turnover cost, overtime spend, average time to productivity, and current idle time percentage. If internal data is not yet clean enough to produce these numbers, industry benchmarks from SHRM, Gartner, and McKinsey are a reasonable starting point. Even a rough baseline is more useful than no baseline. Precision improves with each quarter you track.
Step 2: Identify Your Value Levers
Workforce analytics creates financial value through a limited number of specific levers: turnover reduction lowering replacement cost, utilization improvement increasing output per payroll dollar, faster onboarding shortening the time to productivity curve, overtime reduction lowering unplanned payroll spend, and compliance cost avoidance reducing exposure to regulatory penalties. Assign a conservative dollar estimate to each lever using the baseline data from Step 1.
Step 3: Apply the ROI Formula
The formula itself is simple. ROI equals value generated minus the cost of the analytics investment, divided by the cost of the analytics investment, multiplied by one hundred.
Here is a worked example using a single lever. A three hundred person company with an average salary of fifty thousand dollars sees fifteen percent annual voluntary turnover, or forty five departures a year. At a replacement cost of seventy five percent of salary, that is roughly $1.6 million a year in turnover costs. If a workforce analytics platform reduces voluntary turnover by twenty percent, that removes nine departures and saves approximately $337,000. Against a platform cost of $60,000 a year, the ROI works out to $337,000 minus $60,000, divided by $60,000, multiplied by one hundred, which equals 462 percent.
Readers should substitute their own numbers here. This example uses only one lever; most organizations see value accumulate across three or four levers at the same time, which compounds the return well beyond what any single calculation shows.
Step 4: Report It Quarterly, Not Annually
ROI is not a one time calculation. It drifts without ongoing tracking, particularly as headcount, turnover, and workload shift quarter to quarter. A workforce analytics dashboard built for COO level reporting should surface turnover trend, utilization by department, overtime variance, and productivity score by team automatically, without requiring a manual pull from three different systems. A quarterly cadence keeps the investment visible and defensible the next time it comes up at the board level.
See the Four Step ROI Model Running on Your Own Workforce Data
Book a personalized walkthrough of how wAnywhere surfaces turnover, utilization, and overtime trends automatically.
The Most Common Mistakes COOs Make When Measuring Workforce Analytics ROI
Even COOs who are sold on the value of workforce analytics often undermine their own ROI case through a handful of repeatable mistakes.
- Tracking activity instead of outcomes, such as measuring how many reports HR runs rather than what decisions actually changed as a result.
- Operating with no baseline at all, which makes it impossible to prove ROI regardless of how strong the underlying program is, since there is no starting point to measure improvement against.
- Siloed data, where HR, payroll, and productivity systems do not integrate, so the resulting insight is fragmented and any ROI calculation built on top of it is unreliable.
- Relying only on lagging indicators. Historical data tells you what already went wrong. Predictive workforce analytics tells you what is about to go wrong, giving leadership a window to act before the cost is locked in.
- Measuring performance only at the company level, which hides the variance between high and low performing teams, and that variance is usually where the real cost inefficiencies are concentrated.
Read More: Importance of Workforce Analytics in Remote Workplace
What a Workforce Analytics Platform Needs to Make ROI Measurable
Not every platform that calls itself a workforce analytics tool is built to support the ROI model above. Before signing off on a vendor, COOs should check it against a short list of requirements.
- Real time, COO level dashboards rather than HR level activity reports, since a financial summary is what gets used in a board conversation and raw activity data is not.
- Productivity tracking that works across remote, hybrid, and on site teams, because a platform that only functions well for office based staff misses where most workforce cost variance actually lives today.
- Automated alerts for financial anomalies, such as overtime spikes, utilization drops, or flight risk signals, early enough to act before they become realized costs.
- Integration with payroll, HRMS, and project management tools, since ROI calculations depend on connected data rather than manual exports stitched together after the fact.
- Configurable KPIs, since every organization defines productivity differently.
- Compliance ready data handling, which matters most for distributed or cross border teams where regulatory exposure carries a real financial cost of its own.
wAnywhere is built around this exact list. It provides COO level workforce analytics dashboards with real time productivity tracking, utilization reporting, and compliance ready monitoring across remote and hybrid teams, so the numbers in this guide are not theoretical.
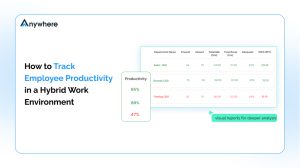
Read More: How to Track Employee Productivity in a Hybrid Work Environment
Presenting the Business Case to Your Board
Building the ROI model is only half the job. Presenting it in a way that lands with the board is the other half, and it requires a different framing than the calculation itself.
Board members respond to three things: cost reduction, risk mitigation, and growth enablement. The strongest business cases touch all three rather than leaning on one. A clean one page structure works well. Open with the current state, drawn from your baseline numbers. Follow with the proposed investment, covering platform cost and implementation time. Then the projected return, broken into twelve month and twenty four month savings across each value lever. Close with risk mitigation, covering turnover risk, compliance exposure, and operational continuity.
Two things tend to matter more than the rest. Lead with turnover cost specifically, since it is the most universally understood and emotionally resonant workforce cost in any boardroom. And present a conservative ROI estimate rather than an optimistic one. Boards trust conservative numbers more, and a conservative number that gets exceeded builds more credibility for next year’s investment than an optimistic one that falls short.
Conclusion
Workforce analytics ROI is provable. It requires the right metrics, a real baseline, and the discipline to track progress quarterly instead of waiting until year end to ask whether the investment worked. COOs who build this into their regular operating rhythm make faster, better evidenced decisions on what is usually their largest cost base.
The four step model here is simple by design: set a baseline, identify your value levers, run the ROI formula, and report it every quarter. Start with whichever lever has the most reliable data behind it today, and let the rest follow as your baseline matures.
Put This Framework to Work on Your Own Team
Start a free 14 day trial of wAnywhere and see your turnover, utilization, and productivity numbers in one dashboard.
FAQ
What metrics should a COO track for workforce performance?
Revenue per employee, employee utilization rate, voluntary turnover rate by department, time to productivity for new hires, the overtime and idle time ratio, and absenteeism rate.
What is the best workforce analytics software for enterprise?
Platforms offering real time COO level dashboards, cross environment productivity tracking, automated anomaly alerts, payroll and HRMS integration, configurable KPIs, and compliance ready data handling.
How does predictive workforce analytics reduce costs?
It flags flight risk signals, overtime spikes, or utilization drops before they convert into realized costs.
What is a good ROI for people analytics investment?
No universal benchmark exists, but a conservative single lever calculation often shows returns well above 100 percent for mid sized companies with above average turnover.