One dashboard for office and remote teams
Productivity Dashboard That Shows How Work Really Gets Done
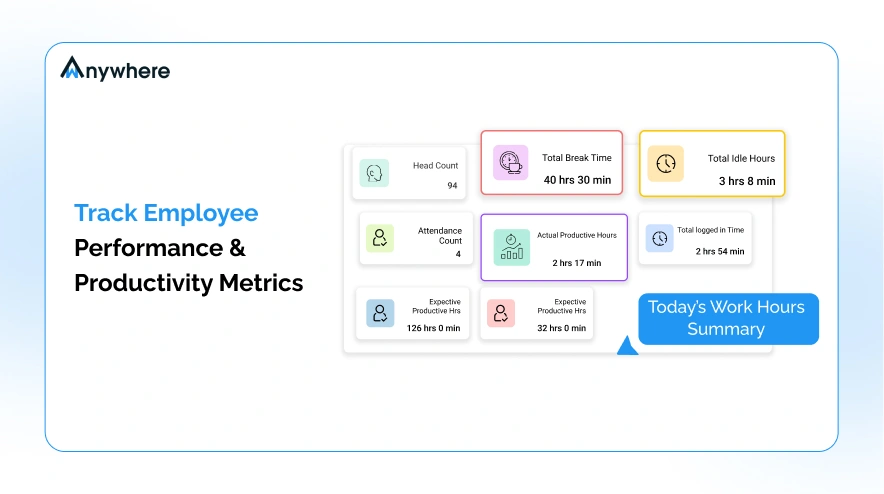
wAnywhere's productivity dashboard brings active time, idle time, app usage and behavior insights into one view. The same agent that secures every seat also tells you how productive it is.
Available for:




What Is a Productivity Dashboard
A productivity dashboard is a single screen that shows how employees spend their working time, using data such as active time, idle time, breaks and application use. Managers use it to spot trends, compare teams and act on problems without building reports by hand. An employee productivity dashboard does the same for one person.
Hybrid Teams Are Hard To Measure And Harder To Trust
When half the team works from home, output reports alone cannot tell you how time is spent. Operations leads end up managing by assumption, and risky behavior hides inside normal working hours.
Where Productivity Blind Spots Show Up
Most gaps come from data that exists but never reaches one place.
- 1Hidden idle time. Logged-in hours that include long inactive stretches.
- 2Untracked breaks. Break and aux time that never shows in timesheets.
- 3Unproductive apps. Time spent on websites and tools unrelated to work.
- 4Burnout signals. Overloaded employees spotted only after attrition.
- 5Disconnected tools. Productivity and security data sitting in separate systems.
What Changes With wAnywhere
Every seat feeds the same dashboard, with security context built in.
Without wAnywhere
- Reports are built by hand each week
- Remote work is a black box
- Drops in output are unexplained
- Productivity and security are separate
With wAnywhere
- Productivity reports update in real time
- Office and remote teams sit on one dashboard
- Behavior insights show focus, overload and distraction
- One agent covers both
Real Productivity Results From Real Teams
Funnl, a B2B lead generation company with a fully remote team of more than 500 people, rolled out wAnywhere in a single day. After rollout, team productivity rose by 52%.
52%
Increase in team productivity
500+
Remote employees covered
1 day
To deploy
What Is An Employee Productivity Report?
An employee productivity report shows how working time is spent across activity, applications and breaks. wAnywhere builds these reports automatically from data captured on every device.
Four data layersEach report draws on four data layers.
-
Time data
Login, logout, active, idle, break and aux time.
See time tracking -
Usage data
Applications and websites used during work.
See app and website usage -
Behavior insights
AI signals for focus, overload, distraction and compliance issues.
See activity tracking -
Visual evidence
Screenshots, where enabled, to support reviews.
See screenshots
Productivity Metrics and Formulas
Most productivity reports are built on eight metrics, and each has a simple formula. Knowing the formula matters, because it tells you what a number really means before you act on it.
The table shows each formula, a worked example and where wAnywhere gets the data.
| Metric | Formula | Worked Example | Where wAnywhere Pulls It From |
|---|---|---|---|
| Productivity rate | Output divided by hours worked | 120 tickets divided by 40 hours = 3 tickets per hour | Hours from time tracking |
| Utilization rate | (Productive hours divided by available hours) times 100 | (34 divided by 40) times 100 = 85% | Apps and website usage and time tracking |
| Active time % | (Active time divided by logged time) times 100 | (7 divided by 8.5) times 100 = 82.4% | Activity tracking |
| Idle time % | (Idle time divided by logged time) times 100 | (0.75 divided by 8.5) times 100 = 8.8% | Activity tracking |
| Absenteeism rate | (Unplanned absent days divided by scheduled days) times 100 | (3 divided by 60) times 100 = 5% | Attendance management |
| Schedule adherence | (Minutes in scheduled state divided by scheduled minutes) times 100 | (432 divided by 480) times 100 = 90% | AUX management |
| Focus time | Sum of uninterrupted productive work blocks | 40 + 55 + 30 minutes = 2 hours 5 minutes | AI behavior insights in activity tracking |
| Output per hour | Units completed divided by active hours | 96 claims divided by 6 active hours = 16 per hour | Task-based productivity and activity tracking |
Follow in order
How to Measure Employee Productivity in Six Steps
To measure employee productivity, pick a few metrics that fit each role, set a baseline, then track trends rather than single days. The method below works with any tool.
Each step builds on the one before it.
-
Choose role-fit metrics
Pick two or three metrics that match what each role is actually paid to do.
-
Record a baseline
Track two to four weeks before you set targets, so goals reflect normal work.
-
Automate capture
Collect time and activity automatically so the numbers don’t rely on memory.
-
Normalise breaks and aux
Exclude scheduled breaks and aux time so a lunch break isn’t counted as idle.
-
Review trends
Look at weekly and monthly patterns instead of reacting to one bad day.
-
Act on outliers
Talk to the person first, then keep the process running in a productivity dashboard instead of spreadsheets.
Productivity Measurement Methods Compared
There are four common ways to track employee productivity: self-reporting, manual logs, output review and automated activity tracking. Automated tracking gives the most complete picture, but it works best alongside output review, not instead of it.
Here’s an honest look at each.
| Method | Pros | Cons | Best For |
|---|---|---|---|
| Self-reporting | Cheap and quick to start. | Depends on memory and honesty. Hard to compare. | Small teams with high trust. |
| Manual logs and timesheets | Familiar and easy to audit on paper. | Time-consuming, often filled in late and easy to round up. | Billing hours to clients. |
| Output review | Measures results, not activity. | Says little about where time went or why output dropped. | Roles with clear, countable output. |
| Automated activity tracking | Accurate, real time and consistent across office and remote seats. | Needs clear policies and employee notice to keep trust. | BPO, call center and hybrid teams at scale. |
Types of Productivity Reports
Productivity reports come in eight common types, split by time period, by scope and by purpose. Each one answers a different question for a different reader.
Here’s what each type is for.
Daily productivity report
Shows yesterday’s active, idle and break time, so team leads can fix problems before they repeat.
Weekly productivity report
Shows trends across the week, and is what most operations managers review.
Monthly productivity report
Gives leadership a view of utilization and headcount needs.
Individual report
Covers one employee, and is used in one-to-ones and reviews.
Team report
Compares people and shifts within a team, so workload can be rebalanced.
Project report
Shows hours and output against a project, and is useful for client billing.
Shift report
Tracks login, adherence and aux time for each shift, which matters most in call centers.
SLA report
Connects staffing and active time to client service levels.
What a wAnywhere Productivity Report Contains
A wAnywhere productivity report covers each employee’s login and logout times, active and idle time, breaks, aux time and application use for the period you choose. AI behavior insights and KPIs sit alongside, so productivity and compliance data come from one agent.
These are the fields a report draws on.
| Field | What It Shows |
|---|---|
| Employee and team | Who the report covers, for any user or team. |
| Date range | Any period, in real time or historical. |
| Login and logout | When the working day started and ended. |
| Active and idle time | Time with and without activity. |
| Break and aux time | Breaks and other non-desk work states. |
| Apps and websites | The tools used during working hours, marked productive or non-productive per role. |
| Behavior insights | AI signals for focus, overload, distraction and compliance issues. |
| KPIs | Productivity rate, absenteeism and time on productive apps. |
| Screenshots | Visual evidence, where enabled. |
Productivity Dashboard Features Built For Operations Leads
Each feature answers a question your operations and security leads ask every week. Here is what the dashboard covers.
Real-Time Activity View
See active time, idle time, breaks and aux time as they happen. Spot coverage gaps before they affect SLAs. See AUX management.
App And Web Usage Tracking
Know which applications and websites take up working hours. Classify tools as productive or non-productive for each role.
AI Behavior Insights
AI flags when employees appear focused, overloaded or distracted. Managers can act early on workload and wellbeing.
KPI Tracking
Measure KPIs such as time on productive applications, productivity rate and absenteeism automatically. Compare individuals and teams on the same dashboard.
Historical Productivity Reports
Pull reports for any user, team or period. Trends over weeks and months show what is improving and what is slipping.
Privacy Controls
Use screen blurring and access controls to track only the metrics that matter. Sensitive data stays protected while you measure work.
How wAnywhere Productivity Reports Work
Install once and the data starts flowing. Three steps take you from rollout to insight.
01
Deploy the agent
Install wAnywhere on office and remote devices and define productive apps per role.
02
Capture activity
Time, usage and behavior data is recorded automatically across every seat.
03
Review and act
Dashboards and productivity reports show trends, outliers and next steps.
Why Operations And Security Leaders Use It
Productivity data is most useful when it also explains risk. Each team gets a clear benefit.
For Operations Heads
- Track utilization and idle time across every shift
- Spot overloaded or disengaged employees early
- Back SLA and staffing decisions with real data
For IT Security Leads
- See productivity and risk signals from one agent
- Catch unusual activity patterns inside working hours
- Reduce the number of tools on every endpoint
For Compliance Managers
- Keep historical activity records for reviews
- Show clients how remote work is supervised
- Apply privacy controls to what is captured
If your weekly productivity reports still come from spreadsheets, Book A Demo and see what an automated dashboard replaces.
Reports on your rhythm
Reporting Frequency and Export Options
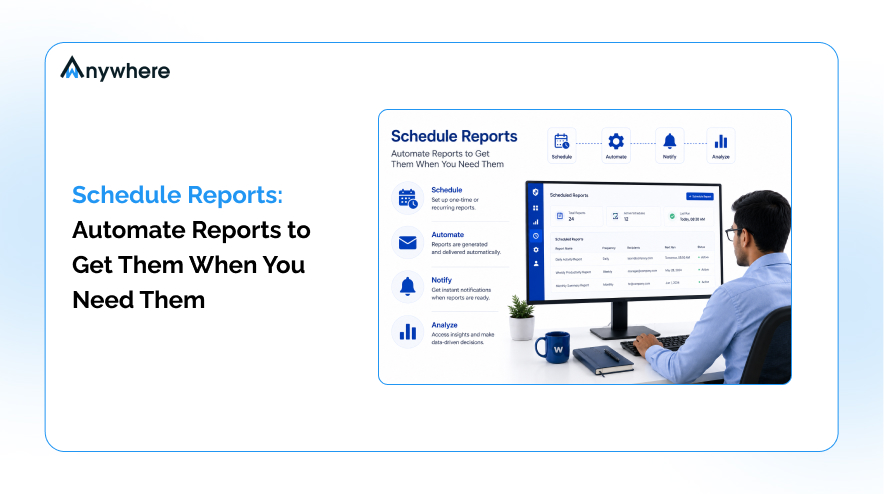
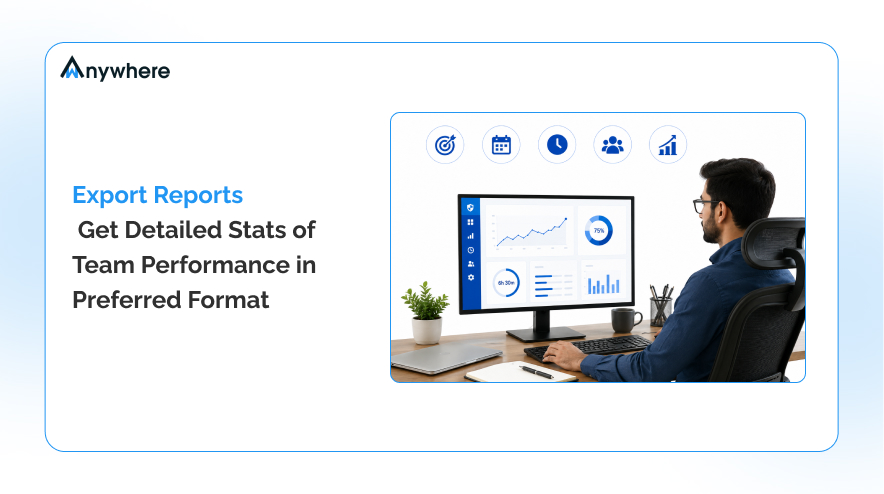
wAnywhere productivity reports can be set to run daily, weekly or monthly, so operations get a regular rhythm without opening the platform every time. You can also export any report to Excel, PDF or CSV for payroll, clients, audits or management.
That covers both regular operations and ad hoc reviews.
Scheduled reports
Run daily, weekly or monthly so ops teams get a steady cadence without manual pulls.
Live dashboard refresh
Watch metrics update in real time while you review a team or shift on the dashboard.
Excel, PDF and CSV
Export any report for payroll, clients, audits or management handoffs.
Flexible filters
Slice by team, employee, date range and app category before you export or share.
Built for regulated teams
Security and Compliance
Employee monitoring only works if employees know what is collected and why. wAnywhere is built so data is encrypted, access is role-based and exports are auditable, with GDPR and privacy settings available for regulated teams.
Match your notice and policy to how tracking is used in your organisation.
Encryption
Data is protected in transit and at rest across office and remote endpoints.
Role-based access
Managers and admins see only what their role allows—nothing extra by default.
Audit-friendly exports
HR and compliance teams get exports they can file, review and trace.
Retention controls
Configure retention and screenshot rules to match your policy and jurisdiction.
Plans That Match Your Reporting Stack
wAnywhere pricing depends on team size and which productivity modules you turn on. See the full breakdown on the pricing page, or book a demo to map plans to your reporting needs.
On every dashboard
Glossary of Productivity Terms
Short definitions for terms you’ll see in dashboards and reports.
Active time
Time with keyboard, mouse or other tracked activity.
Idle time
Logged-in time with no activity after your idle threshold.
Utilization
Productive hours as a share of available working hours.
AUX
Non-call or non-core work states, common in BPO and call centers.
Productive app
Application your policy counts toward productive work for that role.
Productivity rate
Output divided by hours worked, for a given period.
Productivity Insights For Every Way Your Teams Work
In-Office Work
Get accurate attendance, active hours and app usage for every office seat, so managers can see where the working day goes without walking the floor.
Explore In-Office Work
Remote Work
See active time, task progress and app usage for every remote employee in real time, so performance is measured by output rather than online visibility.
Explore Remote Work
Hybrid Work
Track time, attendance and output the same way on office and home days, and compare both to build hybrid schedules that keep every team productive.
Explore Hybrid Work
Productivity Tracking Built For Your Industry
Every industry measures output against different targets. wAnywhere adapts its time, activity and reporting tools to the way your teams deliver work.
Healthcare
Measure active hours and task output for billing, coding and claims teams, and balance workloads with productivity reports that keep patient data masked.
Explore Healthcare
BFSI
Track workloads and productive hours across branches, operations centers and remote desks, so back-office teams hit processing targets with fewer delays.
Explore BFSI
BPO
Monitor agent active time, breaks and idle periods against targets in real time, and redistribute work early so every client SLA and target stays on track.
Explore BPO
Call Center
Track aux states, breaks and login hours for every agent, keep shift adherence high and build SLA reports from accurate data rather than manual logs.
Explore Call Center
IT
Measure focus time, tool usage and task progress across engineering and support teams, so you can remove blockers and keep every project on schedule.
Explore IT
GCC
Compare utilization across departments and locations in real time, spot overloaded and underused teams early and plan headcount on accurate workforce data.
Explore GCC
Startups
Track time, tasks and productive hours across a small, fast-moving team, so you can spot bottlenecks early and grow without adding management overhead.
Explore Startups
Freelancers
Log every billable hour automatically with activity records and timesheets, so you invoice accurately and clients see exactly what they are paying for.
Explore Freelancers
 Ask ChatGPT
 Ask AI Mode
 Ask Claude
 Ask Perplexity
 Ask Grok