

 Set as a preferred Google source
TL;DR
- Counting phone alerts does not prove a security program is working.
- To measure the return on phone-use detection, track ten KPIs across four areas: security risk (violation rate, repeat violations, high-risk incidents), response and compliance (response time, resolution time, policy compliance, confirmed exposure incidents), productivity and operations (output impact, false positives) and financial return (overall ROI).
- Set a baseline before deployment, define every metric and denominator up front, read security and productivity results together, and calculate ROI only from documented costs and defensible benefits.
- No single KPI proves success on its own.

Turn Phone Alerts Into Measurable Security Outcomes
Detect phone use around sensitive screens, alert managers in real time and keep an audit trail your team can measure against.
Why Phone Alert Counts Cannot Prove ROI
A BPO team handles customer financial records on screen all day. To reduce the risk of that data being photographed, its security team rolls out Mobile Phone Detection to flag phone use during restricted work. Three months later, leadership asks two questions. Is the organization actually reducing security risk? And is the investment worth what it costs?
The number of phone alerts cannot answer either question on its own. In a workplace security context, phone-use detection is technology that identifies mobile phone use within a monitored work environment, so the organization can investigate potential policy violations and respond under its own security procedures. Proving that it works, and that it pays for itself, takes a wider set of measures covering policy compliance, repeat violations, response times, operational disruption and business outcomes.
This guide sets out ten KPIs, the formula behind each one, the data you need to track them and a practical framework for calculating ROI across both security and productivity.
Why Should Organizations Measure The ROI Of Phone Detection?
Deploying a security control is only the first step. Once it is live, organizations need to know whether it addresses the risk it was bought for and whether the benefits justify the cost of running it. People remain central to that risk. Verizon’s 2026 Data Breach Investigations Report found that the human element was involved in 62% of breaches, which is why controls aimed at employee behavior deserve the same scrutiny as any other security investment.
Measure Security Outcomes, Not Just Detection Counts
A detection count is an activity metric. It shows that the system fired, not that security improved. A higher count might reflect more phone use, but it might equally reflect better detection coverage, stricter enforcement or a configuration change. A lower count might mean better compliance, or it might mean fewer workstations are being monitored. Read detection data alongside reviewed incidents, repeat violations, remediation records and policy compliance before drawing any conclusion.
Understand The Impact On Productivity And Operations
Security controls can create friction. Check whether alerts, screen locks or case reviews are disrupting legitimate workflows, delaying task completion or adding supervisor workload nobody planned for. The aim is to reduce risky behavior without imposing avoidable cost on the people doing the work.
Build A Business Case For Security Investment
A structured KPI framework gives security and operations leaders a shared language for presenting the program to executives. Outcomes such as shorter investigation time, higher policy compliance and fewer confirmed phone-related exposure incidents carry far more weight in a boardroom than alert volumes. The takeaway is simple. ROI should reflect measurable changes in risk management and operating cost, not the number of events detected.
Also Read : How AI Security & Compliance Tools Prevent Data Breaches in Real Time
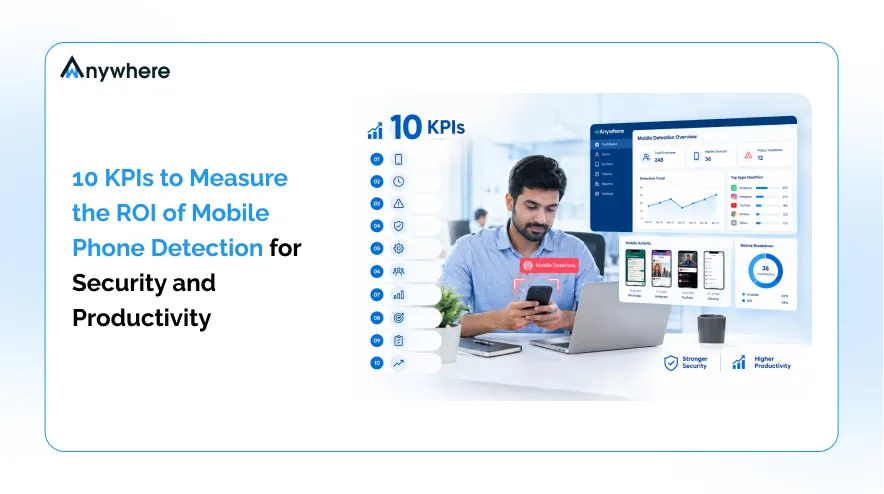
10 KPIs To Measure The ROI Of Mobile Phone Detection
The ten KPIs below move from detection to business value across four categories. They do not all measure the same thing. Leading indicators, such as response time and repeat violation rate, show whether the program is working day to day. Outcome indicators, such as confirmed exposure incidents and ROI, show what it has ultimately changed.
| SNo | KPI | What it measures | Main business value |
| 1 | Mobile phone policy violation rate | Frequency of confirmed violations | Policy compliance |
| 2 | Repeat violation rate | Recurrence after an initial violation | Effectiveness of coaching and corrective action |
| 3 | High-risk phone-use incident rate | Share of reviewed events classified as high risk | Security risk visibility |
| 4 | Average time to respond | Time from alert to first defined response | Response efficiency |
| 5 | Average time to resolve | Time to documented case closure | Remediation efficiency |
| 6 | Mobile phone usage policy compliance rate | Share of eligible reviewed sessions meeting policy | Compliance measurement |
| 7 | Phone-related data exposure incident rate | Confirmed phone-related exposure incidents | Security outcomes |
| 8 | Productivity impact | Change in relevant work output or quality | Operational impact |
| 9 | False-positive rate and unnecessary disruption | Incorrect alerts and avoidable interruptions | Efficiency and employee experience |
| 10 | Overall ROI | Quantified benefits relative to total costs | Financial justification |
Security Risk KPIs (1 To 3)
1. Mobile Phone Policy Violation Rate
This KPI measures how often detected phone-use events are confirmed to violate your policy, showing how frequently restricted phone use actually occurs.
Formula Violation Rate = (Confirmed Policy Violations ÷ Total Eligible Monitored Sessions) × 100
Define an eligible session and a confirmed violation before calculating anything. A team of 1,000 will naturally generate more events than a team of 100, so consistent denominators are what make comparisons fair. Segment by department, shift or restricted workflow where useful.
How to interpret it: A rising rate may mean more violations, better coverage or a policy change. A falling rate may signal better compliance, but check it against coverage first. Never treat every detected phone as a violation without reviewing the context.
2. Repeat Violation Rate
This KPI tracks the percentage of employees with a confirmed violation who commit another within a defined follow-up period, showing whether coaching and corrective action are working.
Formula Repeat Violation Rate = (Employees With a Repeat Violation ÷ Employees With an Initial Confirmed Violation) × 100
Fix the follow-up window, for example 30 days. Repeat incidents often point to unclear rules, weak training or ineffective interventions, so check whether repeats fall after corrective action.
How to interpret it: A falling repeat rate suggests interventions are working. Read it alongside changes in monitoring coverage, workforce composition and reporting practices.
3. High-Risk Phone-Use Incident Rate
This KPI measures the share of reviewed phone events classified as high risk because of the work context or potential exposure of sensitive information, such as phone use during a restricted customer-data workflow or a phone positioned towards a sensitive screen. Detection alone cannot establish intent or confirm a photograph was taken, so classification usually needs contextual review.
Formula High-Risk Incident Rate = (Reviewed High-Risk Phone Events ÷ Total Reviewed Phone Events) × 100
A glance at a permitted notification during an approved break is not equivalent to a violation inside a sensitive workflow. Use documented severity criteria based on data sensitivity and workflow restrictions.
How to interpret it: A decline in high-risk incidents may indicate stronger adherence to controls. Check it against confirmed exposure incidents and detection coverage so that one metric does not carry the whole conclusion.
Also Read: Copy Paste Detection to Control Malicious Intent and Protect Data Security
Response And Compliance KPIs (4 To 7)
4. Average Time To Respond To A Phone-Detection Alert
This KPI measures the time between an alert and the defined first response, whether that is a notification, an automated warning, a screen lock or an investigation.
Formula Average Response Time = Sum of Response Times ÷ Number of Alerts Responded To
Use one definition of “response” throughout, and report the median too if a few delayed alerts distort the average. Clear routing, escalation rules and named owners all reduce delays.
How to interpret it: Shorter times usually signal a more efficient workflow, but speed should never replace proper review of a critical event.
5. Average Time To Resolve A Phone-Use Violation
This KPI measures the time from a confirmed violation being logged to its documented closure under your remediation process.
Formula Average Resolution Time = Sum of Violation Resolution Durations ÷ Number of Resolved Violations
Resolution may involve reviewing evidence, speaking with the employee, coaching, recording corrective action or escalating. An immediate notification does not mean the issue is resolved, and a documented mobile detection and remediation workflow makes that distinction easier to track.
How to interpret it: Shorter is better only if cases are not closed early. Track overdue cases and unresolved high-risk events alongside the average.
6. Mobile Phone Usage Policy Compliance Rate
This KPI measures the proportion of reviewed employee sessions or relevant work periods that meet your policy requirements.
Formula Policy Compliance Rate = (Compliant Reviewed Sessions ÷ Total Reviewed Eligible Sessions) × 100
A clearly documented mobile phone usage policy for employees is the baseline that compliance is measured against. At a minimum, it should specify:
- When phone use is prohibited, permitted or restricted.
- Which workflows involve sensitive information.
- When employees can use phones during breaks or emergencies.
- How detection data will be reviewed and used.
- How employees can ask questions or challenge an incorrect finding.
Review uncertain events before classifying them so ambiguous cases do not skew the rate.
How to interpret it: A higher rate may show that communication, training and enforcement are working. Read it alongside severity, repeat violations and coverage.
7. Phone-Related Data Exposure Incident Rate
This KPI tracks confirmed incidents in which phone use contributed to the exposure of sensitive information. It is a more direct security outcome than detection volume, though such incidents may be rare.
Formula Phone-Related Exposure Incident Rate = (Confirmed Phone-Related Exposure Incidents ÷ Total Eligible Monitored Work Hours) × 1,000
The multiplier of 1,000 is an illustrative convention, and any consistent denominator works. Separate a detected phone, a suspected violation and a confirmed exposure. Unauthorized photographing counts as exposure only when the investigation supports it, which is why mobile detection for sensitive customer data needs a documented classification process behind it.
How to interpret it: A decline is positive, but rare events need cautious reading. Monitor high-risk events rather than waiting for an actual exposure.
Also Read: What Can Employee Monitoring Software Do for Your Organization
Productivity And Operational Impact KPIs (8 And 9)
8. Productivity Impact Of Phone Detection
This KPI tests whether detection and its related interventions affect work output, task completion, service quality or time spent on core activities. Compare relevant operational measures before and after implementation, such as:
- Completed tasks per employee or shift.
- Average handling time in a contact center.
- Quality assurance scores.
- SLA attainment.
- Time lost to unnecessary alerts or workflow interruptions.
Productivity is role specific, so pick measures that fit the team. Compare equivalent periods and control for changes in staffing, workload and process. Less phone use does not automatically mean higher output, and the link between mobile detection and workforce productivity has to be shown with data rather than assumed.
How to interpret it: Look for stable or improved outcomes alongside better security results. If output falls, check whether alerts or screen locks are causing unnecessary disruption.
9. False-Positive Rate And Unnecessary Workflow Disruption
This KPI measures the proportion of reviewed alerts that turn out to be incorrect or that do not represent a policy violation under your defined rules.
Formula False-Positive Rate = (Alerts Reviewed as False Positives ÷ Total Reviewed Alerts) × 100
An oversensitive setup wastes supervisor time, interrupts work and erodes employee trust. Review a sample of alerts periodically, adjust configuration where supported, and track separately how often automatic screen locks fire unnecessarily.
How to interpret it: A lower rate improves efficiency and trust, provided legitimate alerts are not being suppressed.
Also Read: Why Workforce Analytics Matters in the Remote Workplace
Financial Return KPI (10)
10. Overall ROI Of Phone-Use Detection
This KPI shows whether the measurable benefits of the program justify its implementation and ongoing operating costs.
Formula ROI (%) = [(Quantified Benefits – Total Costs) ÷ Total Costs] × 100
Potential benefits to include
- Reduced time spent reviewing and resolving relevant incidents.
- Reduced administrative effort associated with policy enforcement.
- Lower investigation and remediation costs, where demonstrable.
- Measurable savings from avoided disruption or duplicated manual processes.
- Documented changes in relevant security incident costs, where a defensible attribution method exists.
Costs to include
- Software subscription and licensing.
- Deployment and configuration.
- Training and change management.
- Ongoing administration and alert review.
- Investigation and remediation work.
- Any additional operational costs associated with the program.
Measure value against a baseline, never count a benefit twice and never assume every detected phone would have caused a breach. Benchmarks still help frame the risk. IBM’s Cost of a Data Breach Report 2026 puts the global average cost of a data breach at a record USD 4.99 million, up 12% on the previous year. That figure helps executives understand what is at stake, but it is not a benefit you can claim on your own ROI line without a defensible attribution method.
How to interpret it: ROI is most credible when the assumptions, measurement period, costs and benefits are all documented and agreed in advance.
How To Measure These KPIs Without Misinterpreting The Data
Ten metrics are only useful if they are measured the same way every time. These four practices keep the numbers honest and comparable.
Establish A Baseline Before Deployment
Collect relevant historical data before rollout wherever it exists, including existing policy violations, confirmed incidents, investigation time, quality scores and operational output. If reliable history is not available, document the limitation and build a baseline during a defined initial measurement period.
Define Every KPI And Its Data Source
Agree up front on what counts as a violation, a high-risk incident, a false positive, a response and a resolved case. Use consistent denominators and reporting periods so that results can be compared fairly over time.
Review Security And Productivity Metrics Together
No single KPI establishes success. A falling violation rate means more when detection coverage has stayed stable and other indicators support the conclusion. Faster resolution likewise counts only when it has not come at the expense of proper investigation.
Segment Results Carefully
Review results by work type, department, shift or risk level where it is appropriate and proportionate. Avoid comparisons that penalize teams for differences in workload or exposure to sensitive information.
How A Mobile Phone Usage Policy For Employees Supports Better ROI
Technology alone cannot set clear workplace expectations. A documented and communicated policy defines what behavior is acceptable, how violations are assessed and what corrective action may follow. Without it, every KPI above is measured against a moving target.
Define Permitted And Restricted Phone Use
Spell out when employees can use phones, which workflows carry restrictions and how breaks and emergencies are handled.
Explain Monitoring And Evidence Handling
Tell employees what the detection system is designed to identify, when monitoring applies, who can review evidence and how that information is used and retained.
Connect Policy Enforcement To Coaching And Improvement
Match the response to the context and severity of each event. Training and clarification often suit minor or first-time violations, while serious or repeated breaches may need escalation under the established policy. A transparent, proportionate policy makes KPI results easier to interpret and stops compliance being measured against unclear or inconsistently enforced rules.
How wAnywhere Helps Organizations Measure Phone Detection Outcomes
wAnywhere’s Mobile Phone Detection capability identifies phone use during monitored work and supports a structured workflow for handling potential violations. Depending on configuration, it can alert managers by email or notification, block the screen when a phone is detected and keep an audit trail of detection events for review, with a remediation workflow to document how each case is handled. Together, these help BPO, BFSI and healthcare operations protect sensitive customer information from unauthorized photography or recording.
Those event records give security leaders a consistent starting point for tracking violation, response, compliance and operational KPIs. Productivity comparisons and financial ROI will usually also draw on business data from outside the platform, such as QA scores, SLA results and cost records. If you are building a measurable case for phone-use controls, explore wAnywhere’s mobile detection or book a demo to discuss how it fits your security and compliance requirements.
Measure What Mobile Phone Detection Actually Changes
Counting alerts will never establish ROI on its own. Security leaders need to measure confirmed violations, repeat behavior, high-risk incidents, response and remediation efficiency, policy compliance, productivity impact and the full cost and value of the program. Start with a baseline, define every KPI consistently and review security and operational outcomes side by side. That is how a detection tool becomes a defensible security investment. If you are ready to put that framework into practice, explore wAnywhere’s mobile detection solution and see how it can support your workplace security requirements.
Build A Security Business Case Your Leadership Can Trust
See how wAnywhere helps BPO and BFSI teams protect customer data from phone capture and document every violation from alert to closure.
Frequently Asked Questions
How Do You Measure The Effectiveness Of Phone Detection?
Track confirmed violation rates, repeat violations, high-risk incidents, response times, policy compliance and relevant security outcomes. Interpret the results alongside detection coverage and operational context rather than relying on alert counts.
What KPIs Should Be Included In A Mobile Phone Usage Policy For Employees?
Set measurable expectations and track indicators such as confirmed policy violations, repeat incidents, compliance rates and the completion of corrective actions.
How Do You Calculate The ROI Of Phone-Use Detection?
Subtract total costs from quantified benefits, divide the result by total costs and multiply by 100. Use documented costs and defensible benefit estimates drawn from the same measurement period.
Can Phone Detection Improve Employee Productivity?
It can help reduce specific distractions and risky behaviors, but productivity gains are not automatic. Compare relevant operational outcomes before and after deployment while accounting for other factors that affect performance.
Does A Higher Number Of Phone Detections Mean Security Is Getting Worse?
Not necessarily. More detections may reflect more risky behavior, better coverage or changes in policy and configuration. Review confirmed violations, incident severity, repeat behavior and monitoring coverage before drawing conclusions.

Table of Contents
Boost productivity and compliance with wAnywhere
Read summarized version with